First Election Results Forecast – Australian 2013 Election

Making preference flow distributions at the district level at this stage of the campaign is somewhat more art than science. The biggest blob of uncertainty now is the actual strength of the Palmer Union Party (PUP). Palmer is making a lot of noise and a lot of promises (namely to spend other people’s money and strengthen the mining industry in which he has a sizable financial interest) and he already has more than 100 candidates signed up. My guess at this stage is that his party is pulling roughly 5% nationally and some of what I have read about Palmer and his party’s candidates suggests that the party will be more popular in rural districts. There was some evidence of a higher percentage of Other voters in rural districts in my first-preference estimation and this may be the result of PUP. Palmer however has yet to indicate the preference flow he will suggest to his supporters.

There is of course the almost complete uncertainty at this stage as to the number of independents and upstream minor parties that will run in any given district. There is also uncertainty of the number of seats that the Christian Democrats will run candidates in. I have assumed for this estimation that the Family First party will run candidates in the same Queensland, Victoria, South Australia and Western Australia districts they ran candidates in in 2010 and that these candidates will win the same percentage of votes in these districts they won in 2010. I have assumed that Family First will not run candidates in New South Wales. I have also assumed that the Family First preference allocation percentages in each district where they run candidates will be the same as the average across all districts in the 2010 election. Since the Family First party’s supporters are part of the Other group of voters, I then stripped out the Family First votes out of the Other group and assumed a preference distribution to these parties of 30% Liberal group, 30% Labor, 30% Greens and 10% Family First. To simplify the analysis I assumed that the Family First party would finish fourth in every district in which they run candidates. Preference allocations of the Liberal group, Labor and Green parties were assumed to be the same as in the 2010 election.

With all of this uncertainty, I can only say that changes are likely to take place between now and the election as the minor party situation sorts itself out. With all of that said, my initial estimation is that the Liberal group will gain 22 seats, for a total of 95, while Labor will lose 20 seats, for a total of 52, in the upcoming election. I estimate that in 22 districts the two-party preference vote for the Liberal group and Labor will be between 47% and 53% and that 12 of these seats will be marginal for Labor and 10 will be marginal for the Liberal group. This suggests that the election could be a lot closer with a shift of several percentage points at the national level towards Labor:

National Estimation

Liberal Group Labor Green Independent
Marginal 10 12 0 0
2013 95 52 1 2
2010 73 72 1 4

A big shift is likely in the New South Wales delegation. Many of the races in New South Wales in 2010 were close and so a fairly small shift here will create a sizeable earthquake. I have the Liberal Group gaining 13 seats while Labor is set to lose 11. However, at this stage six Liberal group seats are marginal against only two for Labor. If the election is going to be closer than we now think, Labor will need to hold these potentially marginal Liberal group districts:

New South Wales Estimation

Liberal Group Labor Green Independent
Marginal 6 2 0 0
2013 33 15 0 0
2010 20 26 0 2

The Liberals are poised to make gains of four seats in Victoria at the expense of Labor and my call now is for an even 18-18 split in the state’s delegation. I also expect the single Green MP in Melbourne district to retain his seat in the upcoming election. This assessment may change if the overall support of the Greens continues to drop. With three Labor seats marginal against only one for the Liberals, there is some chance of Labor losing its majority in this state’s delegation:

Victoria Estimation

Liberal Group Labor Green Independent
Marginal 1 3 0 0
2013 18 18 1 0
2010 14 22 1 0

In the worst case scenario Labor could be reduced to just two seats in the Queensland state delegation while in a best case scenario at this point the Labor loss would be only two seats. Either way the born-again Prime Minister Kevin Rudd seems likely to retain his seat:

Queensland Estimation

Liberal Group Labor Green Independent
Marginal 1 3 0 0
2013 24 5 0 1
2010 21 8 0 1

My expectation at this point is that there will be no change in the party balance in Western Australia. However, my model suggests that all three Labor seats will likely be marginal and thus there is a chance at this stage of Labor being wiped out in the state:

Western Australia Estimation

Liberal Group Labor Green Independent
Marginal 0 3 0 0
2013 12 3 0 0
2010 12 3 0 0

My expectation is that South Australia will flip to the Liberal group but it is important to note that, at this stage, both seats expected to be gained by the Liberals are marginal. Thus, it is possible that there will no change in the party makeup of this state’s delegation after the upcoming election.

South Australia Estimation

Liberal Group Labor Green Independent
Marginal 2 0 0 0
2013 7 4 0 0
2010 5 6 0 0

I anticipate no change in the delegation makeup in Tasmania, the Capital Territory and in the Northern Territories. I anticipate that the Independent MP in Denison will retain his seat:

Tasmania Estimation

Liberal Group Labor Green Independent
Marginal 0 1 0 0
2013 0 4 0 1
2010 0 4 0 1

Capital Territory Estimation

Liberal Group Labor Green Independent
Marginal 0 0 0 0
2013 0 2 0 0
2010 0 2 0 0

Northern Territories Estimation

Liberal Group Labor Green Independent
Marginal 0 0 0 0
2013 1 1 0 0
2010 1 1 0 0

Initial District Level First Preference Estimations

I have estimated the district-by-district first preference figures using a combination of my ordinary least squares model for the Liberal and Labor groups and the Green party and the Newspoll national and state polls. My model accounts for those MP’s who were first elected in 2010 and who are running as incumbents for the first time; these MP’s will have the benefit of incumbancy they lacked in the last election. My model also accounts for those retirements which have been announced as of this date; those districts will not have the benefit of incumbancy that occured in the last election. I have assumed incumbancy advantages for the single Green MP and for the Tasmania independent who is apparently running for reelection. I used the polling data and my model of those polls to make adjustments at the individual district level across each state. These adjustments were made relative to the 2010 election results. Further adjustments were made to these figures so that the individual district estimations were consistant with the state level estimations. The figure for Others is a residual of the estimations for the Liberal and Labor groups and for the Greens.

These figures suggest a substantial lead at the district level for the Liberal group at this stage in the campaign with the Liberals holding first preference leads in 106 seats; Labor have first preference leads in only 41 districts and have first preference majorities in just four districts. Two independents and the single Green MP have the remaining first preference leads.

In my next post I will estimate the final two party preference results from the estimated preference flow. This will determine the number of seats each party is likely to win in the election were the election to be held today.

State Division Liberal Labor Greens Others
NSW Banks 50% 34% 10% 6%
NSW Barton 51% 33% 9% 6%
NSW Bennelong 56% 24% 9% 10%
NSW Berowra 64% 13% 11% 12%
NSW Blaxland 38% 42% 6% 14%
NSW Bradfield 69% 10% 15% 6%
NSW Calare 57% 20% 7% 17%
NSW Charlton 35% 44% 4% 17%
NSW Chifley 28% 49% 6% 17%
NSW Cook 62% 20% 8% 10%
NSW Cowper 55% 19% 8% 19%
NSW Cunningham 37% 40% 10% 12%
NSW Dobell 45% 37% 7% 11%
NSW Eden-Monaro 46% 34% 8% 12%
NSW Farrer 56% 16% 7% 21%
NSW Fowler 34% 50% 4% 11%
NSW Gilmore 54% 29% 6% 12%
NSW Grayndler 29% 37% 21% 13%
NSW Greenway 39% 40% 5% 17%
NSW Hughes 57% 25% 6% 12%
NSW Hume 57% 24% 5% 14%
NSW Hunter 36% 45% 6% 14%
NSW Kingsford Smith 46% 35% 11% 8%
NSW Lindsay 48% 35% 7% 10%
NSW Lyne 61% 24% 5% 10%
NSW Macarthur 55% 26% 7% 12%
NSW Mackellar 67% 12% 18% 4%
NSW Macquarie 52% 19% 13% 15%
NSW McMahon 41% 42% 9% 9%
NSW Mitchell 67% 17% 6% 9%
NSW Newcastle 48% 27% 12% 14%
NSW New England 51% 32% 5% 12%
NSW North Sydney 64% 13% 12% 11%
NSW Page 47% 36% 6% 11%
NSW Parkes 64% 12% 8% 16%
NSW Parramatta 45% 35% 9% 11%
NSW Paterson 56% 29% 4% 11%
NSW Reid 48% 32% 12% 8%
NSW Richmond 45% 30% 15% 10%
NSW Riverina 69% 9% 10% 12%
NSW Robertson 41% 37% 5% 17%
NSW Shortland 38% 44% 5% 13%
NSW Sydney 33% 34% 20% 13%
NSW Thorsby 33% 48% 5% 14%
NSW Warringah 63% 12% 14% 11%
NSW Watson 42% 41% 9% 8%
NSW Wentworth 64% 12% 15% 9%
NSW Werriwa 36% 46% 10% 8%
QLD Blair 40% 38% 8% 14%
QLD Bonner 52% 28% 8% 11%
QLD Bowman 58% 26% 6% 10%
QLD Brisbane 51% 23% 16% 10%
QLD Capricornia 52% 33% 3% 13%
QLD Dawson 51% 32% 3% 13%
QLD Dickson 51% 29% 6% 14%
QLD Fadden 60% 23% 7% 9%
QLD Fairfax 49% 26% 12% 13%
QLD Fisher 48% 26% 9% 16%
QLD Flynn 52% 32% 3% 12%
QLD Forde 49% 30% 11% 10%
QLD Griffith 38% 40% 8% 14%
QLD Groom 63% 19% 6% 12%
QLD Herbert 51% 32% 4% 13%
QLD Hinkler 57% 29% 1% 13%
QLD Kennedy 29% 16% 2% 53%
QLD Leichhardt 53% 27% 9% 11%
QLD Lilley 43% 37% 8% 12%
QLD Longman 49% 30% 8% 13%
QLD Maranoa 68% 16% 4% 12%
QLD McPherson 59% 21% 9% 10%
QLD Moncrieff 64% 19% 10% 6%
QLD Moreton 45% 32% 14% 8%
QLD Oxley 40% 41% 8% 11%
QLD Petrie 42% 39% 5% 14%
QLD Rankin 39% 41% 8% 11%
QLD Ryan 51% 17% 12% 19%
QLD Wide Bay 61% 20% 8% 11%
QLD Wright 58% 20% 10% 12%
VIC Aston 53% 29% 10% 7%
VIC Ballarat 38% 45% 8% 9%
VIC Batman 33% 37% 20% 11%
VIC Bendigo 48% 32% 11% 9%
VIC Bruce 42% 42% 10% 6%
VIC Calwell 30% 50% 10% 9%
VIC Casey 51% 30% 12% 7%
VIC Chisholm 44% 38% 12% 6%
VIC Corangamite 49% 33% 12% 6%
VIC Corio 36% 45% 10% 9%
VIC Deakin 48% 32% 14% 7%
VIC Dunkley 52% 32% 10% 7%
VIC Flinders 59% 25% 12% 4%
VIC Gellibrand 38% 41% 10% 12%
VIC Gippsland 57% 25% 7% 11%
VIC Goldstein 57% 24% 13% 7%
VIC Gorton 26% 57% 8% 9%
VIC Higgins 54% 23% 19% 4%
VIC Holt 34% 48% 10% 7%
VIC Hotham 37% 48% 8% 8%
VIC Indi 56% 21% 11% 12%
VIC Isaacs 39% 42% 11% 8%
VIC Jagajaga 39% 40% 12% 9%
VIC Kooyong 60% 17% 17% 6%
VIC Lalor 27% 58% 2% 13%
VIC La Trobe 40% 40% 10% 10%
VIC Mallee 63% 22% 11% 4%
VIC Maribyrnong 34% 49% 9% 9%
VIC McEwen 33% 48% 6% 12%
VIC McMillan 53% 29% 9% 9%
VIC Melbourne 26% 32% 38% 4%
VIC Melbourne Ports 42% 33% 20% 6%
VIC Menzies 58% 26% 10% 7%
VIC Murray 69% 17% 10% 4%
VIC Scullin 40% 43% 5% 11%
VIC Wannon 52% 21% 7% 20%
VIC Wills 27% 45% 19% 10%
SA Adelaide 42% 34% 11% 14%
SA Barker 59% 18% 9% 14%
SA Boothby 48% 26% 8% 17%
SA Grey 60% 21% 7% 12%
SA Hindmarsh 43% 35% 10% 12%
SA Kingston 32% 42% 9% 16%
SA Makin 35% 40% 8% 17%
SA Mayo 51% 15% 16% 18%
SA Port Adelaide 27% 45% 11% 17%
SA Sturt 52% 26% 6% 15%
SA Wakefield 37% 38% 10% 15%
WA Brand 42% 36% 13% 9%
WA Canning 49% 36% 3% 13%
WA Cowan 53% 28% 10% 10%
WA Curtin 64% 14% 12% 9%
WA Durack 60% 23% 12% 5%
WA Forrest 58% 23% 11% 8%
WA Fremantle 41% 34% 14% 11%
WA Hasluck 48% 29% 13% 10%
WA Moore 53% 26% 11% 11%
WA O’Connor 66% 16% 10% 8%
WA Pearce 51% 29% 11% 10%
WA Perth 41% 35% 13% 10%
WA Stirling 53% 27% 9% 12%
WA Swan 49% 30% 7% 13%
WA Tangney 58% 21% 10% 10%
ACT Canberra 31% 42% 16% 11%
ACT Fraser 26% 43% 17% 13%
NT Lingiari 37% 36% 11% 17%
NT Solomon 52% 28% 13% 7%
TAS Bass 37% 44% 11% 8%
TAS Braddon 44% 42% 10% 4%
TAS Denison 27% 29% 14% 30%
TAS Franklin 38% 36% 19% 7%
TAS Lyons 37% 42% 14% 7%

First Estimations for the 2013 Australian Election

I have used the Newspoll polls which are published by The Australian newspaper to estimate the current state of the Australian election. Newspoll quite accurately called the 2010 national election. The table below shows my estimation based on the most recent national poll which was published on June 2. State level polling is currently done quarterly and the most recent poll was published on March 31st. I have made estimations at the state level based both on the quarterly polling dating back to September of 2012. New national and state polls should be published shortly and I will update my estimations when those new polls are published.

June 2 National and State Estimations

Note that the figures for New South Wales include the two Australian Capital Territory seats while the two Northern Territory seats are not included in the above table. The figures for Tasmania are extrapolated from my estimations for Victoria state.

I estimate that the Liberal group have a substantial 16 percentage point lead at the national level and they appear to lead in every state with the exception of Tasmania. The Greens appear at this stage of the election to be running about two percentage points behind their 2010 election performance at the national level with the steepest decline in their support taking place in Queensland; the smallest decline in Green support appears to have taken place in Victoria.

No polling is done on any other party in the Newspoll poll, responses for all other parties are lumped together into an “Other” category. The support for Other parties is much higher at this stage in the campaign than was the case in 2010. Since Newspoll accurately measures the total Other support in 2010 it seems reasonable to assume that this increased support. This increased Others support appears at this point to be due to support for the mining magnate Clive Palmer’s United Party which has at present nominated candidates in 103 districts. I have no indication one way or another of the support level for the Family First party but it is possible that Family First are registering gains in stronghold states such as South Australia.

I will shortly have the first estimates of the first preference support at the individual district level.

Impact of Redistributions in South Australia and Victoria

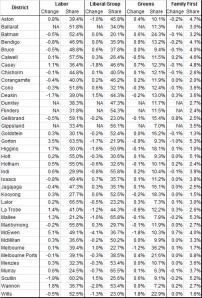
I’ve spent a bit of time calculating the impact of the redistributions in districts throughout South Australia and Victoria (which took place after the 2010 election) on each district. The table below shows the impact of the redistributions for Victoria state for Labor, the Liberal group, the Greens and Family First (click on the table for an easier read):

Victoria Redistribution Table

The biggest changes took place in the McEwen district, which saw a significant shift to Labor. The Greens will lose about 1.2 percentage points in the Melbourne district, the only seat in Parliment they currently hold. Unless there is a major reduction in Green support however, they should hold this seat in the upcoming election. The Casey district tightened up in favor of Labor but the Liberals are likely to hold this seat.

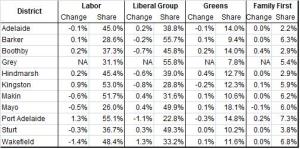
The next table shows the effect of the redistribution in South Australia state:

South Australia Redistribution

The redistribution’s effect was much less in South Australia than in Victoria with only the Hindmarsh district appearing to experience any significant potential impact.

The next stage in my work is to input the effect of these changes into my model and then calculate how the race in districts with no incumbent should change compared with 2010. With these figures in hand, I will then calibrate the 2010 polls with my model and with that calibration in hand, I will be able to make my first forecast for the upcoming election.

Building an Election Forecasting Model

I wanted to discuss in this post the process of creating an election forecasting model for the upcoming Australian election. I have covered some of the steps in the process in earlier posting but I will briefly go over these points here for the sake of completeness.

The first step is understanding the Australian election system, most importantly its preferential voting system. This system produces viable minor parties with the potential of holding the balance of power in individual district elections. Four minor parties presently have this potential. It is possible from election data to precisely measure the effect each of these viable minor parties have on individual elections. This work has been completed.

The second step is to understand demographic and other drivers which explain the share of votes received by the various parties. I have made  statistical models using district level demographic data from the 2011 Census for the two major party groups, the Greens and for the most important of the minor parties to accomplish this. These models use the standard ordinary least squares method. I used the Durbin spatial model to test for spatial autocorrelation across districts but found that the evidence for such autocorrelation is weak.

The third step is to account for changes in district composition since the last election. Two states, South Australia and Victoria, have had nearly all of their districts redistributed since the 2010 election. The changes were somewhat minor in the 11 South Australian districts but were quite significant in many of Victoria’s 37 districts. I have used local polling place results for the 2010 election and redistribution information from the Australian Electoral Commission to estimate the impact of these district changes on the various districts. This work is in progress.

The fourth step is to use polling data to estimate the status of the election at the national and state levels at any given moment in time. I use a Baysian approach to update and adjust existing polling information. The Newspoll group provides regular polling at the national level and periodic state polling. Newspoll’s final polling in the 2007 and 2010 elections was quite accurate and it seems reasonable to make use of this group’s polls in the analysis. The polling estimation is then inputted into the model produced in the second step above to make district level estimations.

These district level estimations are then the fifth step in the process and are estimations of the first preference percentages for the major party groups and for the Greens and Family First parties. Since the full candidate slates will not be available until about 30 days before the election it will be difficult to estimate percentages for the Christian Democrats and Liberal Democrats until we know whether and where they are running candidates. It is also possible that one or two new political parties will emerge in the process and we can estimate the impact of such new parties from the national and state level polling data as well as from media information regarding individual candidates and district races.

Finally, I use the information developed in step one above to estimate the preference distributions for the Greens and other significant minor parties. This produces the final results for each district. I anticipate making a first estimation of the number of seats won by each party shortly.

Model Observations

My modelling of support for the major party’s candidates is taking shape. I have used district level demographic data from the 2010 election to model the support base for the major party groups and the Greens. Four demographic data points have proven to be important in predicting the support base for the major party groups:

1. Percentage of professionals and managers in the district work force. These are people with an elite status in the laborforce.

2. Income. Income is a very tricky measure because low income and high income voters tend to support the same party in Australia. Thus if one models the effect of income as linear such a model would produce an inconclusive result. I have dealt with this problem by taking some point “near” the average median income across districts and calculating the median income distance from this point.

3. Immigrants from non-English countries, non-western. A significant percentage of immigrants to Australia come from English speaking Commonwealth countries most importantly New Zealand, the UK and South Africa. To a lesser extent there are immigrants to Australia from western native speaking English countries such as Ireland, Canada and the US. My assumption is that immigrants from such countries are likely to have general political views in line with Australians and, thus, such immigrants can be treated the same as native Australians. I have used detailed district level demographic data to separate out such native, western, English speaking immigrants from those from other countries. The result is a measure of the number of people that can be called “ethnic” living in each district.

4. Never married. These people tend to be young.

The percentage of professionals and managers in the district work force is very strongly tied with support for the two major party groups and for the Greens. Districts with high percentages of professionals and managers are likely to have an increased support for Liberals while the opposite is true for Labor. Greens also draw a significant percentage of their votes from the same group of professionals and managers supporting Liberals. This suggests that Liberals and Greens are, to some degree, drawing their support from the same population. This is very interesting. Labor’s support, on the other hand, tends to decline with an increasing percentage of professionals and managers in a given district.

I noted above that I calculated the distance from a point “near” the average median income across districts. This calculation showed that districts with median incomes “near” the average median income tended to support Labor while incomes that were higher and lower tended to support Liberal group candidates.

Immigrants from non-English speaking, non-Western countries tend to support Labor. It is interesting to note than these immigrants appear to have very little interest in Green candidates.

Never married people tend to support both Labor and the Greens which suggests that, to some extent, these left-of-center parties are in conflict with each other for this group of voters.

In the end, my analysis suggests that Greens are actually more likely to take votes from Liberals rather than from Labor a result that is counterintuitive. On the other hand, my analysis also suggests that Family First voters are more likely to take votes away from Labor rather than Liberals.

I am now getting closer to creating a model of the 2013 Australian election. The only thing now lying between this and such a model is an analysis of redistricting that has taken place in Victoria and South Australia States.

Australian Electorate Overview

I’ve spent the last several days building a data base of key demographic information at the district level. My goal is to build a model explaining variations in percentage shares received by each political party at the district level. While I still have a bit of work left to do to complete the model, I am able to provide the reader with some broad brush strokes of important demographic factors driving support for the two major party groups and the Greens in the 2010 election:

1. Labor’s support primarily comes from middle class people. Except in relatively poorer Tasmania, the party tends to do less well in districts with lower median incomes with the exception of districts with large populations of immigrants from non-western and/or non-English speaking countries. The party also does well in districts with relatively high concentrations of people who have never been married. However, Labor also competes with the Greens for this segment of the electorate. The party runs poorly in districts with high concentrations of professionals and managers. Labor’s electorate has some similarity to that of the Democrats in the US, particularly in it’s support from ethnic immigrants and young unmarrieds.

2. Liberal support comes at both high and low income levels. High income level support is urban based and is usually tied in with high levels of professional and managerial workers. Curiously, the Liberals appear to compete with the Greens for support from professional and managerial workers. Low income support is rural based especially in Queensland, New South Wales and Western Australia, the latter two states where the Nationals usually run candidates in rural districts. The Liberals/Nationals base of support appears to have more than some affinity with the American Republicans.

3. Green support is concentrated in urban districts with high percentages of unmarrieds and high percentages of professionals and managers and relatively high incomes. The Greens are young and well-heeled and, as such, ethnic immigrants appear to find the party unappealing. The only clear exception to this general run is in Tasmania where the party is popular in spite of the fact that the state is rural and poor. Overall the Greens would appear to share a common bond with urban Democratic progressives in the US.

4. A common thread runs through the four districts that are held by independents. All are relatively poor with median incomes 20% to 40% below the national average. They have very low percentages of ethnic immigrants. Three of the four districts are rural (in New South Wales and Queensland) while the fourth is based in the small city of Hobart in economically distressed Tasmania.

More to come shortly.

The 2010 Australian Election – Tasmania

Tasmania state is a group of islands lying south of Victoria state and off of the southeastern corner of the Australian continent. The smallest Australian state, Tasmania’s main island is about the size of West Virginia but has a population of only about 510,000. The largest town is Hobart whose metropolitan area has a population of about 216,000. Although Hobart’s latitude is about 42.9 degrees south (roughly the same distance from the equator as Boston) snowfall there is extremely rare. Winter snowfall is however common in the mountainous central part of the state where much of the terrain is over 1,000 meters (3,300 feet) in height. Tasmania experiences Australia’s slowest population growth, reportedly due to a stagnant local economy and about one-third of the state’s residents are reliant on the state for their primary income.[1]

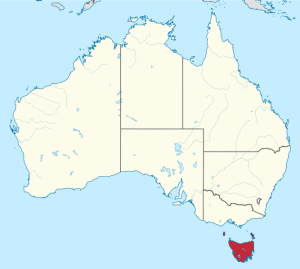
 Map 1

Position of Tasmania in Australia

 667px-Tasmania_in_Australia.svg

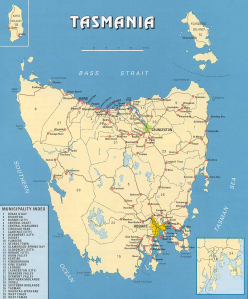
Map 2

Tasmania Major Cities

tasmap-1200

Source: http://www.tas.gov.au

Tasmania is a Labor stronghold and the party took a 5-0 lead in seats in the state going into the 2010 election. The Liberal group made modest first preference vote gains in the election while Labor suffered a 4.6 percentage point drop compared with 2007 with most of those losses becoming the Greens gains. The Labor group lost one seat when an independent candidate, Andrew Wilkie, won a shocking victory in the Denison district, a victory sealed when Liberal voters delivered their preferences to the independent candidate. The Greens scored a strong 16.8% share of the first preference votes:

2010 House of Representatives Election

Tasmania

First Preference Votes

Group or Party

Candidates

Votes

% Share

Seats

Liberal Group

5

109,908

33.6%

0

Labor Group

5

143,796

44.0%

4

Greens

5

55,042

16.8%

0

Midstream Liberal Group

0

0

0%

0

Upstream Group

4

4,618

1.4%

0

Downstream Independent

1

13,788

4.2%

1

Midstream Independent

0

0

0%

0

Totals

20

327,152

100%

5

Source: Australian Election Commission

The Green preference distribution was heavily in favor of the Labor group:

Preference Vote Distribution 2010 Election

Tasmania

From/To Liberal Group Labor Group Net
Greens

11,029

38,919

-27,890

Midstream Liberal Group

0

0

0

Source: Australian Election Commission

The post midstream preferential distribution put Labor up by nearly 19 percentage points over the Liberal group in the state:

2010 Vote Totals After Midstream Preferential Distribution

Tasmania 

Group

Votes

% Share

Liberal Group

120,937

36.97%

Labor Group

182,715

55.85%

Source: Australian Election Commission


[1] All of information in the paragraph is from Wikipedia.

The 2010 Australian Election – Western Australia

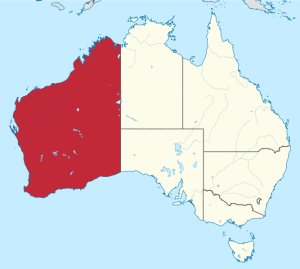
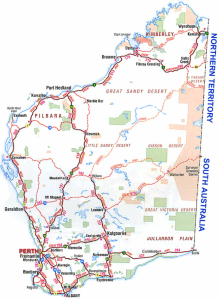
The state of Western Australia is, simply put, vast. At 2.52 million km2 (about 1.02 million sq. miles) the state is about the size of the entire western US sans New Mexico. In that entire vast area are only 2.45 million people and 1.9 million of these people are concentrated in the Perth metropolitan region on Western Australia’s southwest coast. While Perth and nearby areas south of Perth have a Mediterranean climate, most of the state is desert or semi-desert. However, the far north is tropical with heavy monsoon rains. The state’s economy is dominated by mining.[1]

Map 1

Position of Western Australia in Australia

667px-Western_Australia_in_Australia.svg

Map 2

Western Australia Major Cities

 sth-map

Source: http://www.atn.com.au

Western Australia is a Liberal stronghold and the Liberal group took an 11-4 lead in seats in the state going into the 2010 election. The Liberal group made modest first preference vote gains in the election while Labor suffered a 5.6 percentage point drop compared with 2007 with most of those losses becoming the Greens gains. The result was a net pickup of one seat for the Liberal group in the state[2]. The Greens scored a strong 13.1% share of the first preference votes while the midstream Liberal parties earned a respectable 4.0%:

2010 House of Representatives Election

Western Australia

First Preference Votes

Group or Party

Candidates

Votes

% Share

Seats

Liberal Group

19

609,246

50.6%

12

Labor Group

15

375,381

31.2%

3

Greens

15

158,117

13.1%

0

Midstream Liberal Group

29

48,531

4.0%

0

Upstream Group

14

12,726

1.1%

0

Downstream Independent

0

0

0%

0

Midstream Independent

0

0

0%

0

Totals

92

1,204,001

100%

15

Source: Australian Election Commission

The midstream Liberal group parties delivered a strong preference distribution to the Liberal group which offset to some extent good performance by the Greens on behalf of Labor:

Preference Vote Distribution 2010 Election

Western Australia

From/To Liberal Group Labor Group Net
Greens

42,881

130,453

-87,572

Midstream Liberal Group

25,507

7,512

17,995

Source: Australian Election Commission

In the end however, the Liberal group dominated the state:

2010 Vote Totals After Midstream Preferential Distribution

Western Australia 

Group

Votes

% Share

Liberal Group

677,634

56.28%

Labor Group

513,346

42.64%

Source: Australian Election Commission


[1] All of information in the paragraph is from Wikipedia.

[2] I noted in an earlier post that I have counted the seat won by the Nationals over the Liberal incumbent in the O’Conner district as a Liberal group win since, in the end the Nationals MP Tony Crook joined the Liberal-National Coalition.

The 2010 Australian Election – South Australia

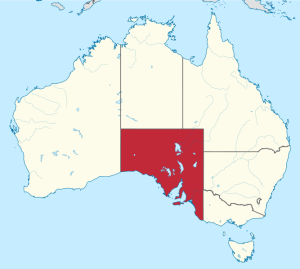
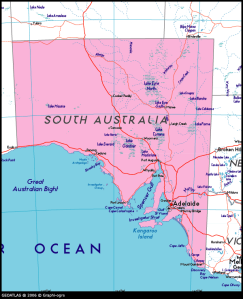
South Australia is big (about the size of Texas and Nevada combined), but with only about 1.65 million population (a bit greater than Idaho). The state is also extremely arid except for areas near the coast in the state’s southeastern corner. This is where the state’s largest city, Adelaide, with a metropolitan population of about 1.26 million people or about three quarters of the state’s residents. Adelaide is the westernmost of Australia’s ring of cities that dot the country’s east and southeast coasts. West and north of Adelaide are some of the earth’s greatest deserts. Adelaide has a Mediterranean climate and its average temperatures are about 2 degrees Celsius higher than Melbourne. It’s annual average rainfall of about 550 mm (21.5 inches) is approximately the same as that of San Francisco.[1]

 Map 1

Position of South Australia in Australia

 667px-South_Australia_in_Australia.svg

Map 2

South Australia Major Cities

south-australia

The Liberal and Labor groups were separated by less than 2 percentage points in the 2007 election in the state and the margin separating them slipped to about 0.5 percentage points in the 2010 election. A 5 percentage point Green surge between 2007 and 2010 in the state (and its attendant preference vote distribution in favor of the Labor group) allowed Labor to maintain unchanged from 2007 its 6-5 seat advantage in South Australia. The midstream Liberal group parties ran a strong 5.3% in the state:

 2010 House of Representatives Election

South Australia

First Preference Votes

Group or Party

Candidates

Votes

% Share

Seats

Liberal Group

11

394,003

40.2%

5

Labor Group

11

399,279

40.7%

6

Greens

11

117,364

12.0%

0

Midstream Liberal Group

15

51,471

5.3%

0

Upstream Group

20

17,832

1.8%

0

Downstream Independent

0

0

0%

0

Midstream Independent

0

0

0%

0

Totals


100%

11

Source: Australian Election Commission

 Preference Vote Distribution 2010 Election

South Australia

From/To Liberal Group Labor Group Net
Greens

33,335

105,324

-71,989

Midstream Liberal Group

27,379

12,326

15,053

Source: Australian Election Commission

2010 Vote Totals After Midstream Preferential Distribution

South Australia 

Group

Votes

% Share

Liberal Group

454,717

46.40%

Labor Group

516,929

52.75%

Source: Australian Election Commission


[1] All of information in the paragraph is from Wikipedia.